WAR: APIs Detailed CloudWatch Metrics
Gaining Granular Insights: Enabling Detailed CloudWatch Metrics for APIs
Gaining Granular Insights: Enabling Detailed CloudWatch Metrics for APIs
API Gateway serves as a cornerstone for building and managing APIs on AWS. To effectively monitor and optimize your APIs, detailed insights into their performance are crucial. Enabling detailed CloudWatch metrics for APIs provides a granular view of API behavior, allowing for proactive problem identification and performance improvements. We will explore the benefits of detailed CloudWatch metrics, how they differ from basic metrics, and the configuration steps to enable them for your APIs.
Understanding API Gateway Metrics and CloudWatch:
- API Gateway Metrics: API Gateway automatically captures basic metrics about API usage, including:
- The total number of API requests.
- The number of successful and failed requests.
- API latency (overall execution time).
- CloudWatch: A centralized monitoring service for collecting, storing, and analyzing metrics emitted by your AWS resources, including API Gateway.
Why Use Detailed CloudWatch Metrics for APIs?
While basic API Gateway metrics provide a general overview, detailed CloudWatch metrics offer a deeper level of granularity:
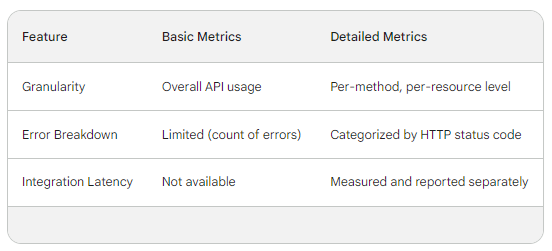
- Per-Method and Resource Level Insights: Detailed metrics provide breakdowns by API method (GET, POST, etc.) and resource path (specific API endpoints). This allows you to pinpoint performance issues or usage patterns for specific functionalities within your API.
- Enhanced Error Tracking: Detailed metrics categorize errors by HTTP status code (e.g., 404 Not Found, 500 Internal Server Error), aiding in identifying the nature and root cause of API errors more effectively.
- Integration Latency Breakdown: If your API integrates with backend services, detailed metrics can reveal latency specifically associated with these integrations, helping isolate performance bottlenecks.
Detailed vs. Basic Metrics in API Gateway:
Enabling Detailed CloudWatch Metrics:
Detailed CloudWatch metrics are not enabled by default for API Gateway. Here's how to activate them:
- API Gateway Console: Navigate to your API in the console, select the "Stages" section, and choose the stage you want to enable detailed metrics for. Under "Metrics enabled," select the checkbox for "Detailed".
- AWS CLI: Utilize the
aws apigateway update-stagecommand with the--metricsEnabledparameter set totrueto activate detailed metrics for a specific stage.
Benefits of Enabling Detailed CloudWatch Metrics:
By enabling detailed CloudWatch metrics for your APIs, you can achieve the following:
- Proactive Performance Management: Gain deeper insights into API behavior, allowing you to identify potential performance issues before they impact users.
- Faster Debugging: Granular error breakdowns facilitate quicker troubleshooting by pinpointing the exact methods or resources causing errors.
- Optimized Resource Allocation: By understanding usage patterns at a method/resource level, you can allocate resources more efficiently to meet specific API endpoint demands.
- Improved API Security: Detailed metrics can aid in detecting suspicious API activity patterns that might indicate security threats.
Conclusion:
Enabling detailed CloudWatch metrics equips you with a powerful tool for monitoring and optimizing your APIs on AWS. The granular insights provided by these metrics empower you to proactively address performance bottlenecks, troubleshoot errors efficiently, and make data-driven decisions to ensure the continued success of your APIs.